


Easy-to-Use Interface
Canvas is designed with ease-of-use in mind. Whether you’re a student, teacher, or parent, Canvas offers a user-friendly interface that simplifies the learning experience, ensuring seamless communication and navigation, intuitive settings, and accessibility features that cater to all. Discover how Canvas empowers...

Interactive Content Delivery
Canvas is a cutting-edge Learning Management System (LMS) that revolutionizes the way educational content is delivered. It is a user-friendly platform that empowers educators to create engaging, interactive experiences for students. With its innovative yet easy-to-use...

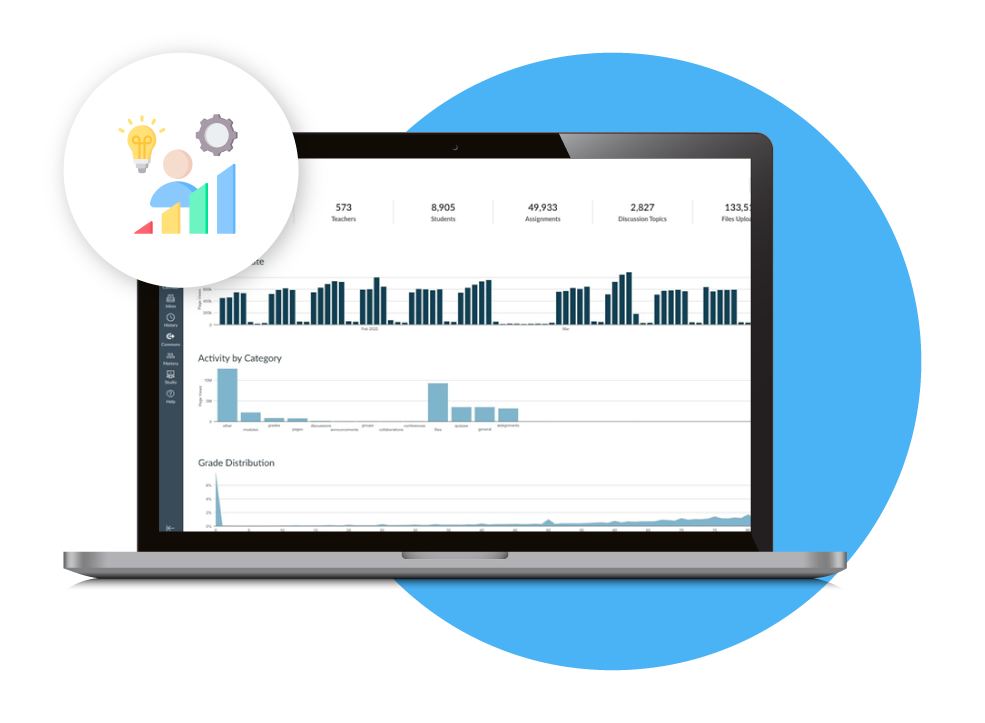
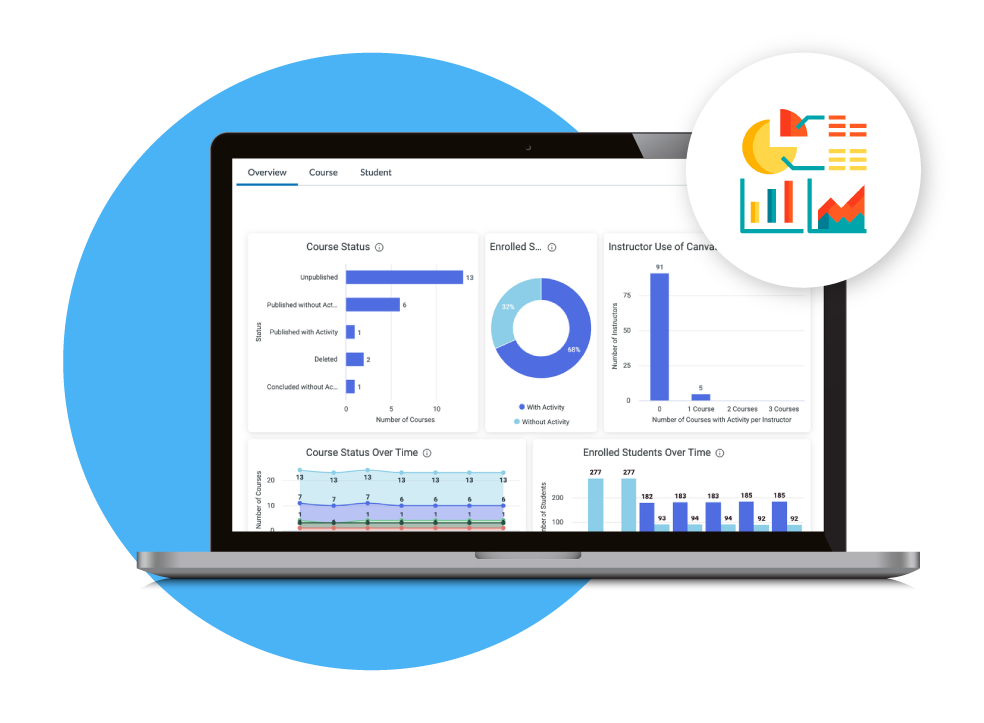
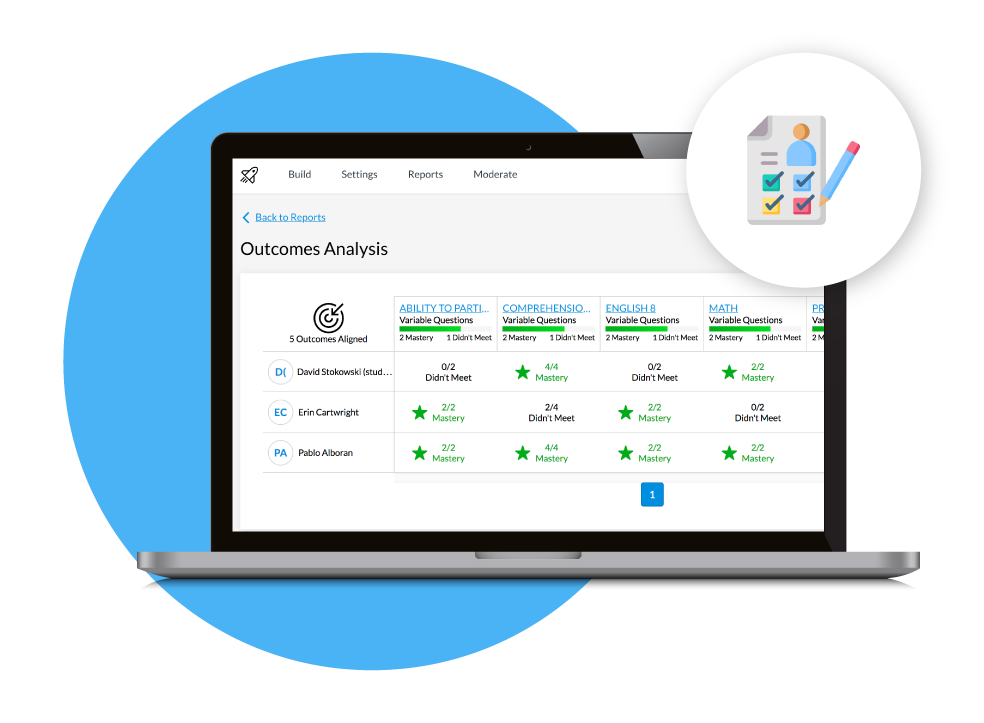
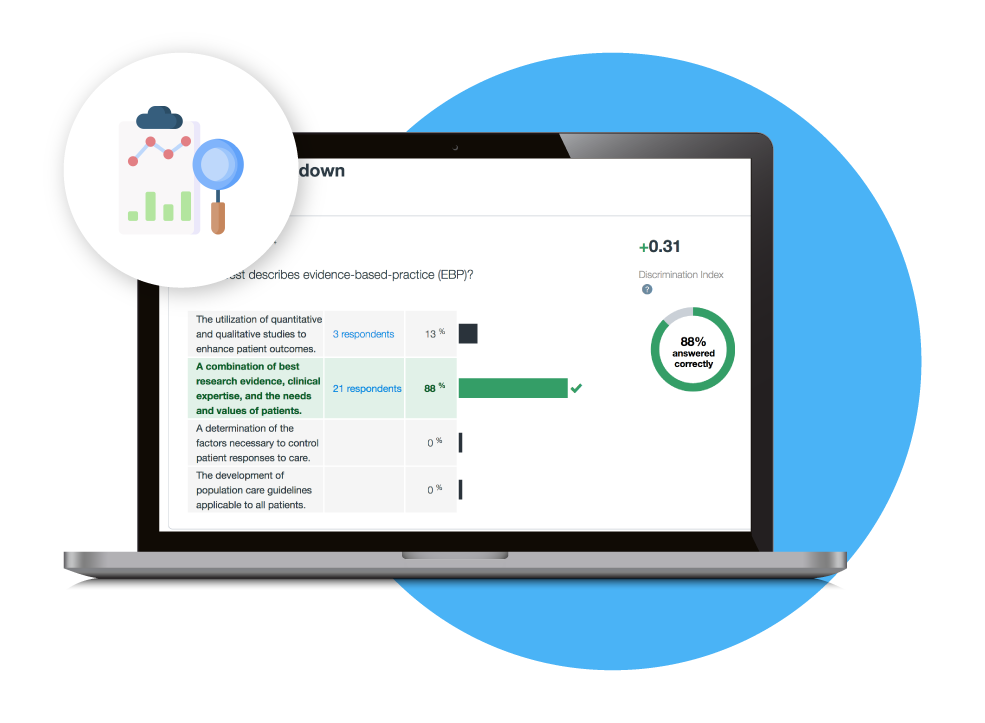
Track and Report Student Progress
Canvas is a versatile and dynamic learning management system that provides robust tools to track and report student progress, ensuring both educators and learners stay informed and engaged. It's a platform that not only empowers educators to keep a watchful eye...
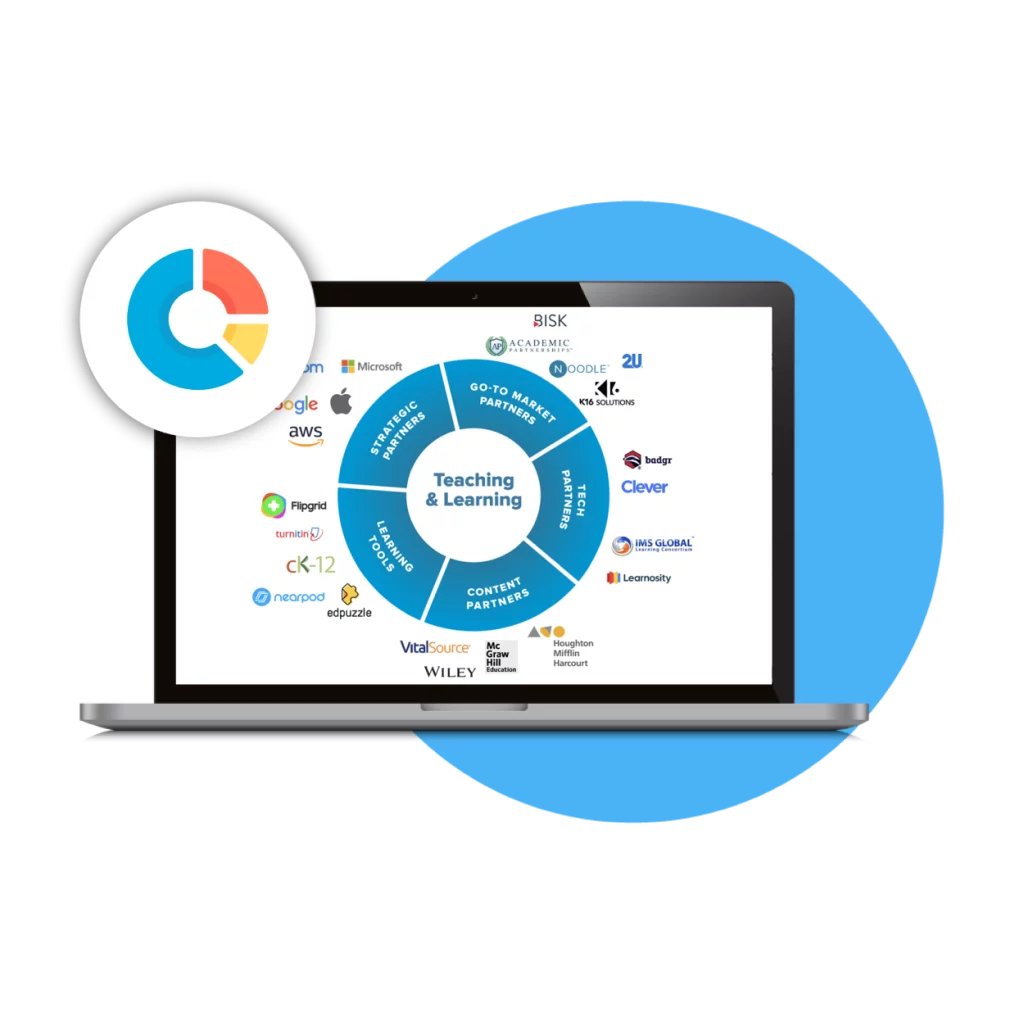
Apps and Integrations
Canvas opens a world of possibilities with its robust ecosystem of integrations that empower teachers and institutions to create a dynamic, and enriched learning environment. With over 450 integrations, users can connect to various tools, and a variety of external apps with unique functionalities in just a...

Mobile & Offline Availability
A robust Learning Management System (LMS) should adapt to diverse circumstances, ensuring students can access course materials even in the absence of an internet connection. This need becomes particularly vital in situations where connectivity is unreliable or nonexistent, such as...